The thrill
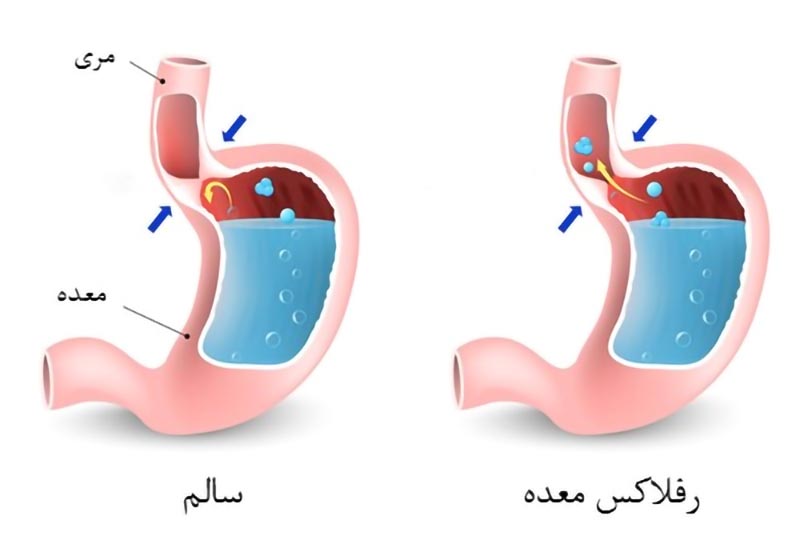
Gastroesophageal reflux disease (GERD) is a common digestive disorder affecting millions of people worldwide. Classical techniques like endoscopy and 24-h pH-metry are often used to diagnose patients with symptoms related to GERD. Although these techniques have been useful over the years both for diagnosis and therapeutic guidance, there are still many patients with GERD symptoms with normal endoscopy and pH-metry who do not respond adequately to anti-secretory therapy.
Multichannel Intraluminal Impedance-pH (MII-pH) monitoring is designed to detect intraluminal bolus movement and allows for detection of Gastroesophageal Refluxes (GER) without the use of radiation. MII-pH monitoring, first introduced by silny et al. in 1991, is a new technique and currently considered as the gold standard for diagnosis of GERD.
MII-pH measurement can be used to study the transit of a bolus and also to determine the physical state of it. It’s intriguing to note that, no biomedical research article is available for the analysis of MII-pH data (except for our previous works), despite the high demands of related clinical literatures towards software developments.
Data Acquisition
For patients with normal endoscopy who did not respond to anti–secretory therapy, 24 hour MII–pH monitoring was carried out, and then archived at Noor and Hazrat–e–Ali Asghar Hospital, Isfahan, Iran. Each study continued for an approximate time of 24 hours. Ambulatory 24 hours esophageal MII–pH monitoring was performed with the mobile recording device (Ohmega Impedance ambulatory pH meter; MMS, Enschede, Netherlands). The six channel impedance–pH catheter was passed transnasally under topical anesthesia and attached above the LES to record pH at and impedance at 3, 5, 7, 9, 15 and 17 cm proximal to the LES. The six impedance sites, including channel 1 through 6, are located within each two consecutive impedance electrodes. Moving from the throat to the LES, the first three impedance sites are referred to the proximal sites and the next three are the distal ones. Data from the impedance channels and the pH electrodes were stored on the portable data recorder, digital data loggers (Ohmega R; MMS B.V., Enschede, the Netherlands) that were connected to the catheter. MMS database software (MMS B.V.) was used for recording and raw data format conversion. MII–pH data was stored at a sampling frequency of . At the end, data were downloaded onto a computer and analyzed using Matlab® R2017a software.
Data Structure
Characterizing GERs from MII data is the key concept for the diagnosis of GERD. The occurrence of all types of GERs can be determined by investigating the MII signal, independently of pH. Driven by this information, for simplicity and also to prevent multi−modal processing, pH data was ignored. In this regard, the data vector provided for the challenge is of a unit impedance type.
In the absence of swallow or GER within the esophagus, the impedance is identified by the electrical conductivity of the inner wall and it is relatively stable and is known as baseline impedance value.
This dataset consists of 174 episodes (2 minutes intervals) of Multichannel Intraluminal Impedance data belonging to 26 individuals. The dataset includes two variables, “IMPEDANCE” and, “FLAG_GER“.
IMPEDANCE: includes impedance data of the 6 different channels for the 174 episodes of 2 minutes, with a sampling frequency of 50 HZ. Each episode contains about 6000 records.
FLAG_GER: determines ground-truth areas of the 6 different channels for the 174 episodes of 2 minutes duration with a sampling frequency of 50 HZ.
The output of this challenge should be the occurrence or non-occurrence (0 and 1) of reflux in the 6th channel. It is worth mentioning that the prediction of the occurrence of reflux in other channels can also play an effective role in this prediction.
Evaluation Policy
The goal of this competition is to predict GER events from Ntest = 27 test episodes. Participants will submit a zipped folder titled as participating group’s name containing
1. a text file titled as “FLAG_eval”, a vector for all 27 episodes in the test set that predicts GER in 6th channel with dimension of 162027
2. A manuscript that explains the applied method.
3. A 5-minute video explaining the code and technique
We will compute the following parameters for the received files compared to the ground-truth annotations.
- Total number of TP, FP and FN events,
- sensitivity and Positive Predictive Value
The winner will be the submission with the highest scores.

